Business Intelligence Lifecycle
Businesses operate with data. Whether a company sells mere fruits or million-dollar products, customers are always the key. They drive the value, and hence understanding their requirements and satisfying them is always the top priority of a business. So, the businesses that understand their customers are the ones that thrive. This is precisely where business intelligence comes in.
Business intelligence serves as the eyes and ears of a business. It helps make analytical, business-driven decisions that involve using the data coming in from different sources. Raw data is unstructured, and while it packs everything you need to have a bird's eye view of the businesses, it's not practical since you cannot understand it. However, Business intelligence makes it talk, turning it into valuable insights.
So today, in this article, we will be going through the complete business intelligence lifecycle, so you can understand how it turns raw chunks of data into amazing stories that become valuable for businesses.
BI Lifecycle
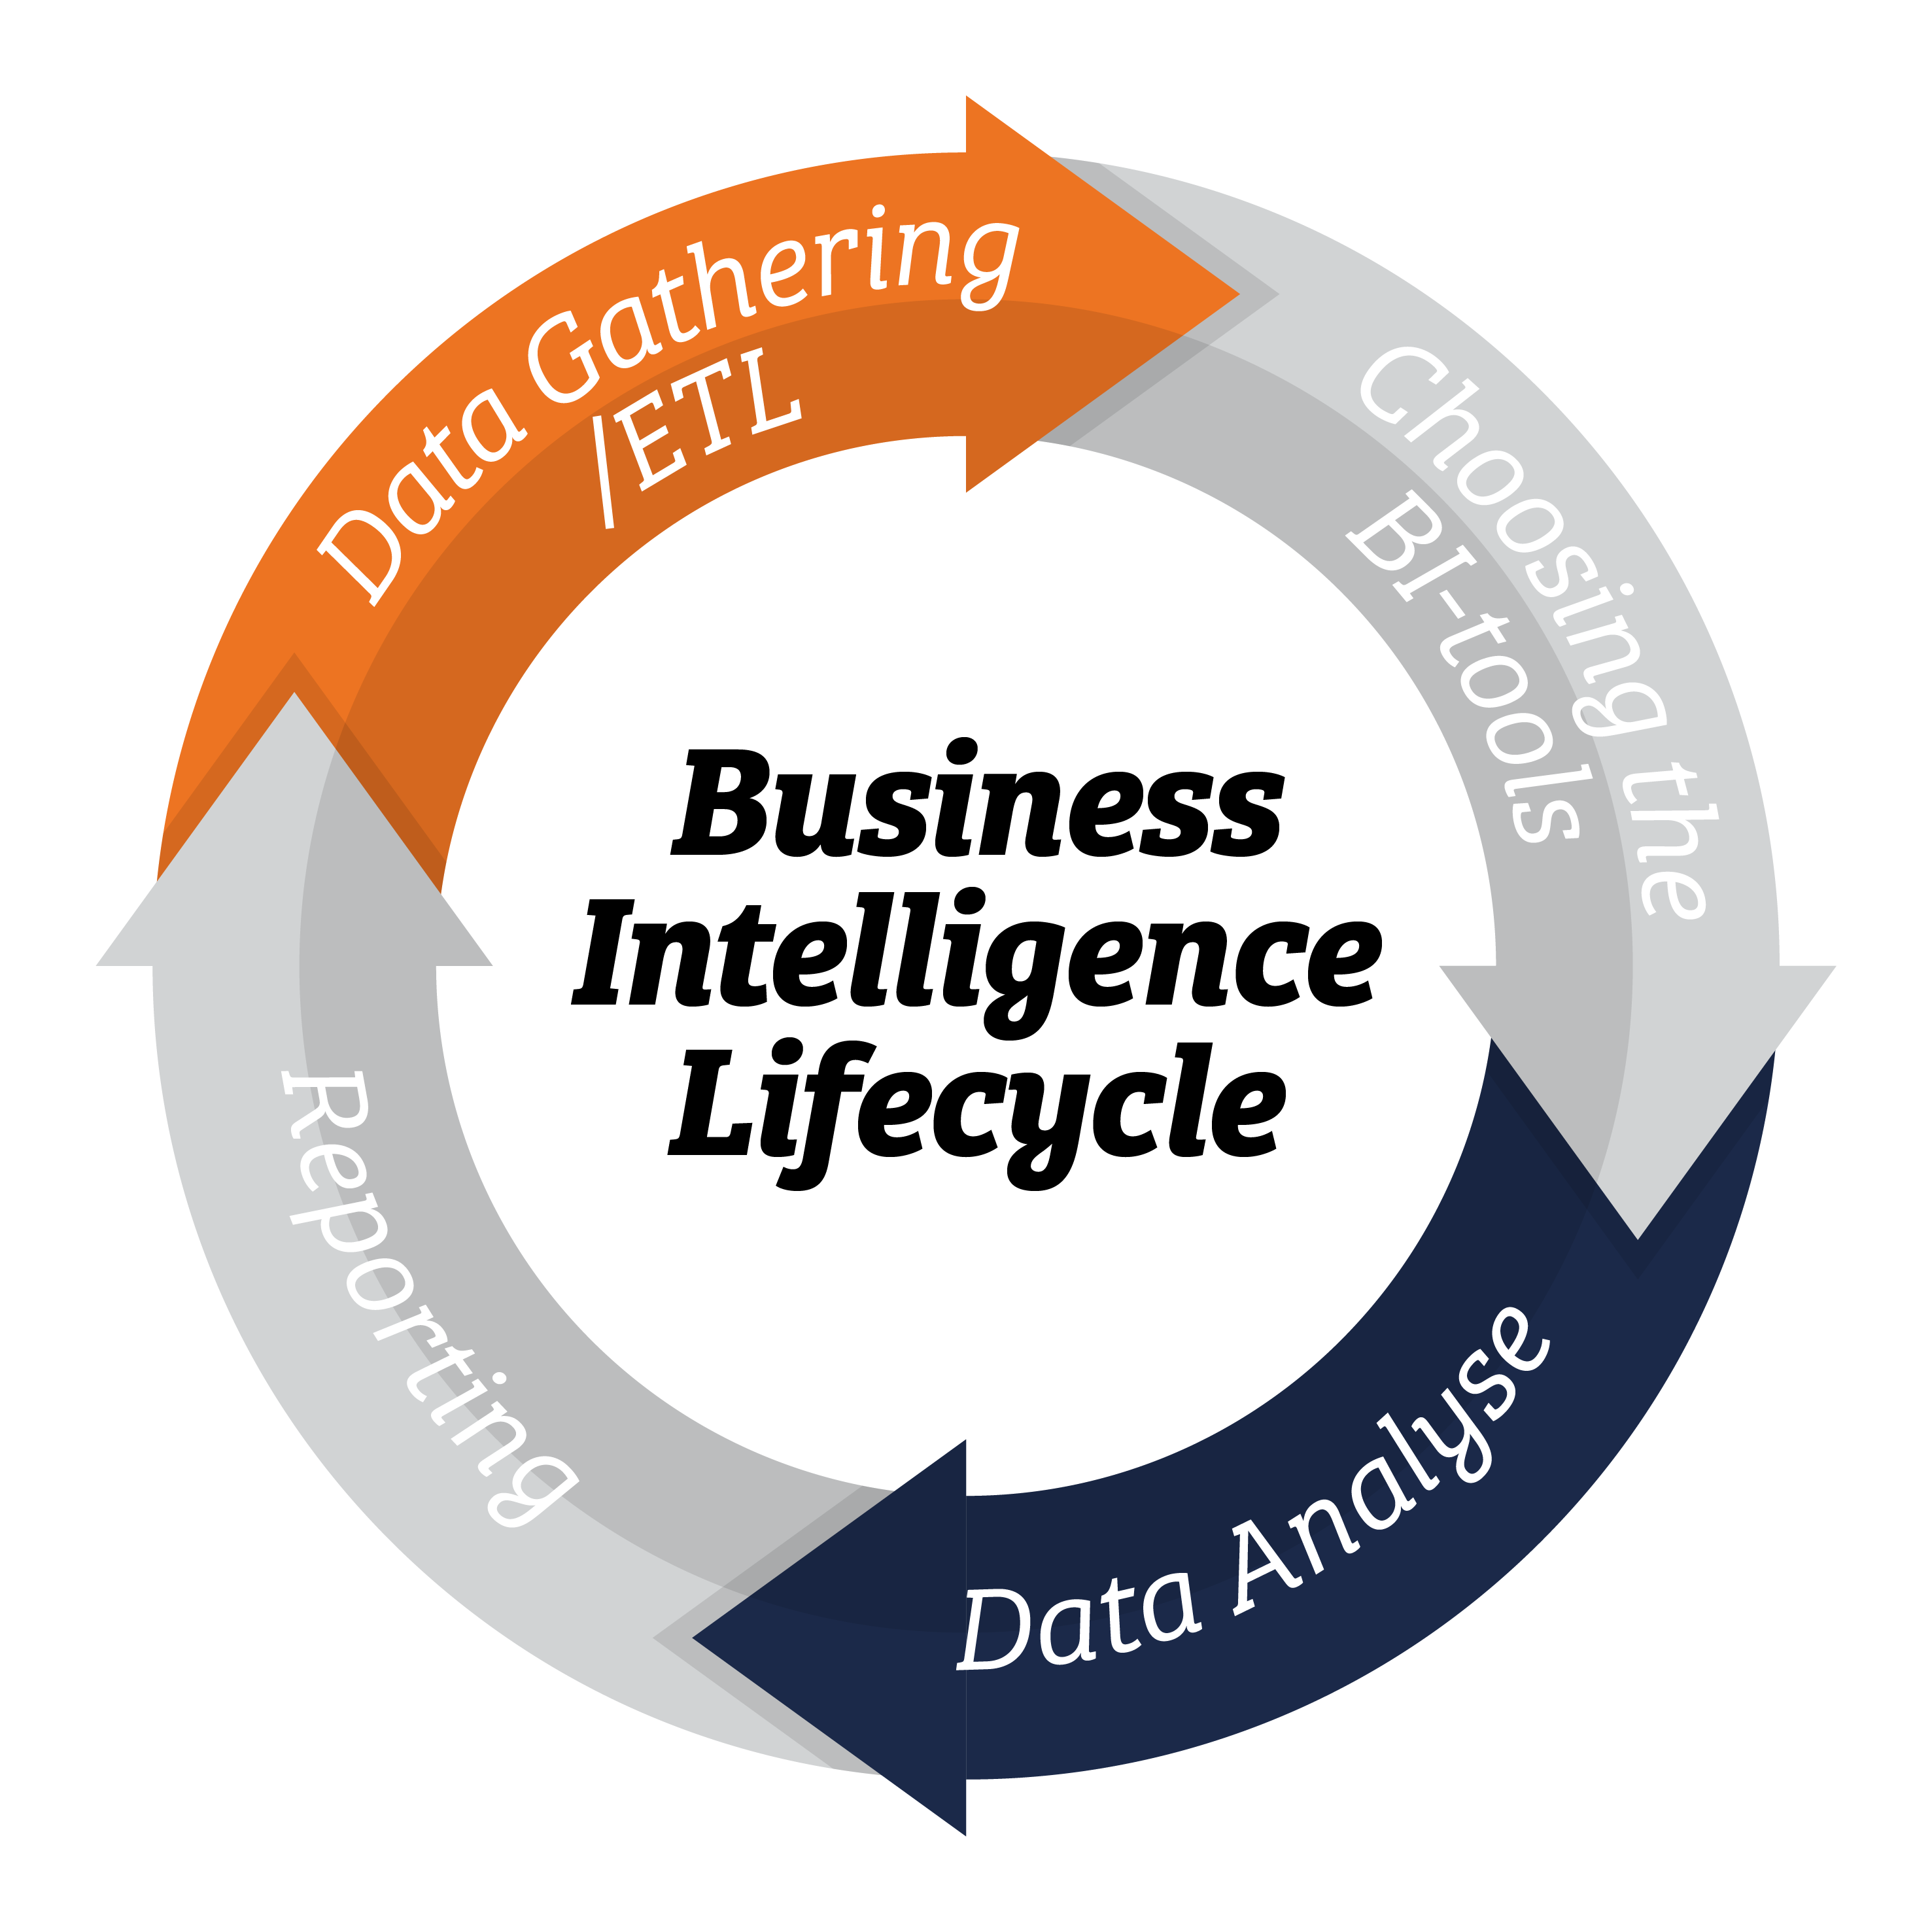
Let’s go through the complete lifecycle of Business Intelligence. From data ingestion to making the final reports, we will cover everything.
1. Data Gathering/ETL
Knowing where to get the data you need is the first step. There are a lot of data sources that can be used to gather data; however, it's essential to know which ones are credible and valuable enough to be trusted.
The first thing you need to know about selecting the data source is your use case. Whether you're aiming to generate sales data, website traffic data, etc. Once you know that, you can uncover different data sources and choose the one that you find the most trustworthy.
After you have finalized the data sources, the next step is ETL – Extract, Transform, Load. This is a very popular method in BI that helps you gather raw data and place it into your data warehouses. After the data is extracted, it's transformed into the required form; this could depend on your warehouse's structure or software requirement. Finally, the data is loaded to be retrieved and used as required.
2. Choosing the BI Tools
Choosing the appropriate tool for your project can be more complicated than it seems. Currently, there are a lot of third-party tools that can be used for your BI solutions. However, some companies with confidential data may find it hard to hand over their data to third-party software. Moreover, each software comes with its respective pros and cons, and it often becomes a headache to choose between them.
However, once you have chosen your tool, it might be hard for you to switch to a different one anytime soon; data migration has costs associated with it, and tools are paid, so make sure you put in enough time choosing the right one software/tool.
There are many great BI tools available in the market you can choose such as:
While these are general BI tools and can be used for various tasks, there are some specific tools available that perform well for some tasks. For example, if you're strictly into financial data, you might find another tool that might not be an excellent fit for generic data but performs fantastically for financial data.
So, always make sure you research the tools in the context of the tasks you have ahead of you. Here's a great article to choose the best BI tool for yourself.
3. Data Analysis
Now comes the actual task. Data analysis is the crux of the whole thing; it's where the actual operations on the data are performed to make it useful for the business. Depending upon the tool or the programming language you're using, you can apply a variety of operations on vast chunks of data, such as aggregations, that can reveal a lot of information the data is hiding.
This information is extracted and visualized beautifully in the form of tables or charts – which you prefer. Not only does this let you identify hidden patterns in data instantaneously, but it also lets you discover valuable insights that couldn’t have been seen in the raw data.
4. Reporting
Last but not least, reporting is the final part of the Business Intelligence lifecycle where you actually get the results of all your efforts. Reporting is the final phase where you present all your findings to whatever stakeholders you're working with, be it your product manager or some external clientele.
Reporting can be done in various forms. Using interactive dashboards is one of the most common ways of creating and sharing reports containing valuable insights for the clients, but there are other ways for reporting as well. Mostly, it's dependent upon your use-case what type of reporting you use; sometimes, mere static reports suffice, while some scenarios require full-fledge dashboards that have integrated data sources and reflect real-time data.
Wrap Up
The amount of data we have on our hands is increasing by the day. IoT and other latest technologies have pushed people to use and create data every second, resulting in massive data. BI lets companies use all this customer data to improve their services and ensure customer satisfaction.
Throughout the article, we went through the complete lifecycle of Business Intelligence, covering each aspect in detail. We saw how it helps companies turn useless raw data into valuable insights that help businesses make data-driven decisions and increase their customer base. Moreover, we also saw some BI tools that could help you implement business analysis effectively and efficiently.

Rakesh Baktawar
Rakesh Baktawar | BI Consultant & Director at bij Sc.Tiger
If you'd like to learn more about this topic, I'd be happy to discuss it with you. Contact me via LinkedIn or email.

